Monitor Engagement
Participants, coordinators, and data scientists each get the level of visibility they need, from personal progress tracking to programmatic data quality analysis.
Spot Problems Early
The dashboard shows color-coded indicators for every participant. Two buttons per card show when they last sent passive sensor data and when they last opened the app.
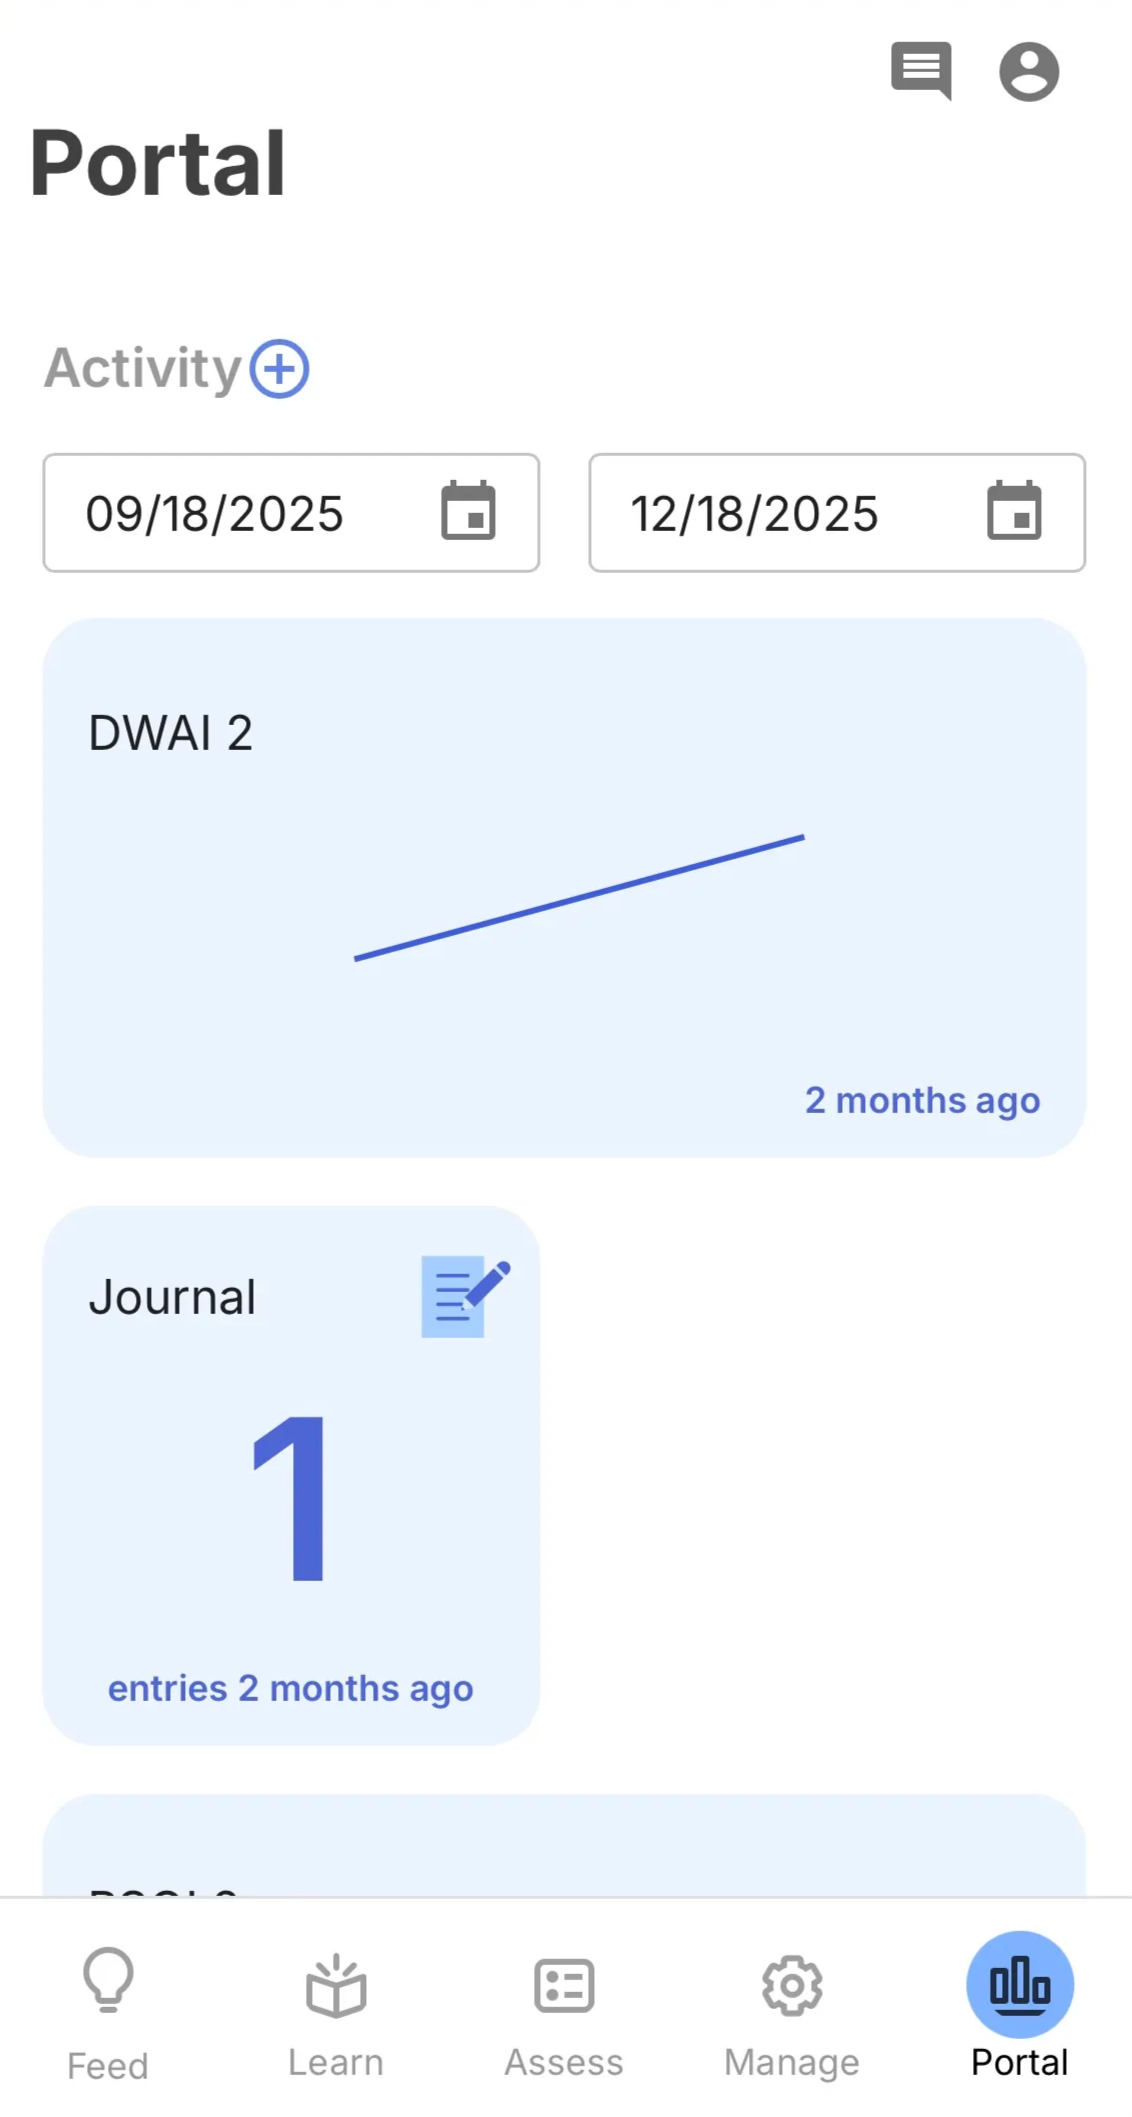
Participants See Their Own Data
The Portal tab gives participants a view of their own activity history, survey trends, and sensor-derived behavioral features. Clinicians see the same view when reviewing a participant, making it a shared reference point during check-ins.
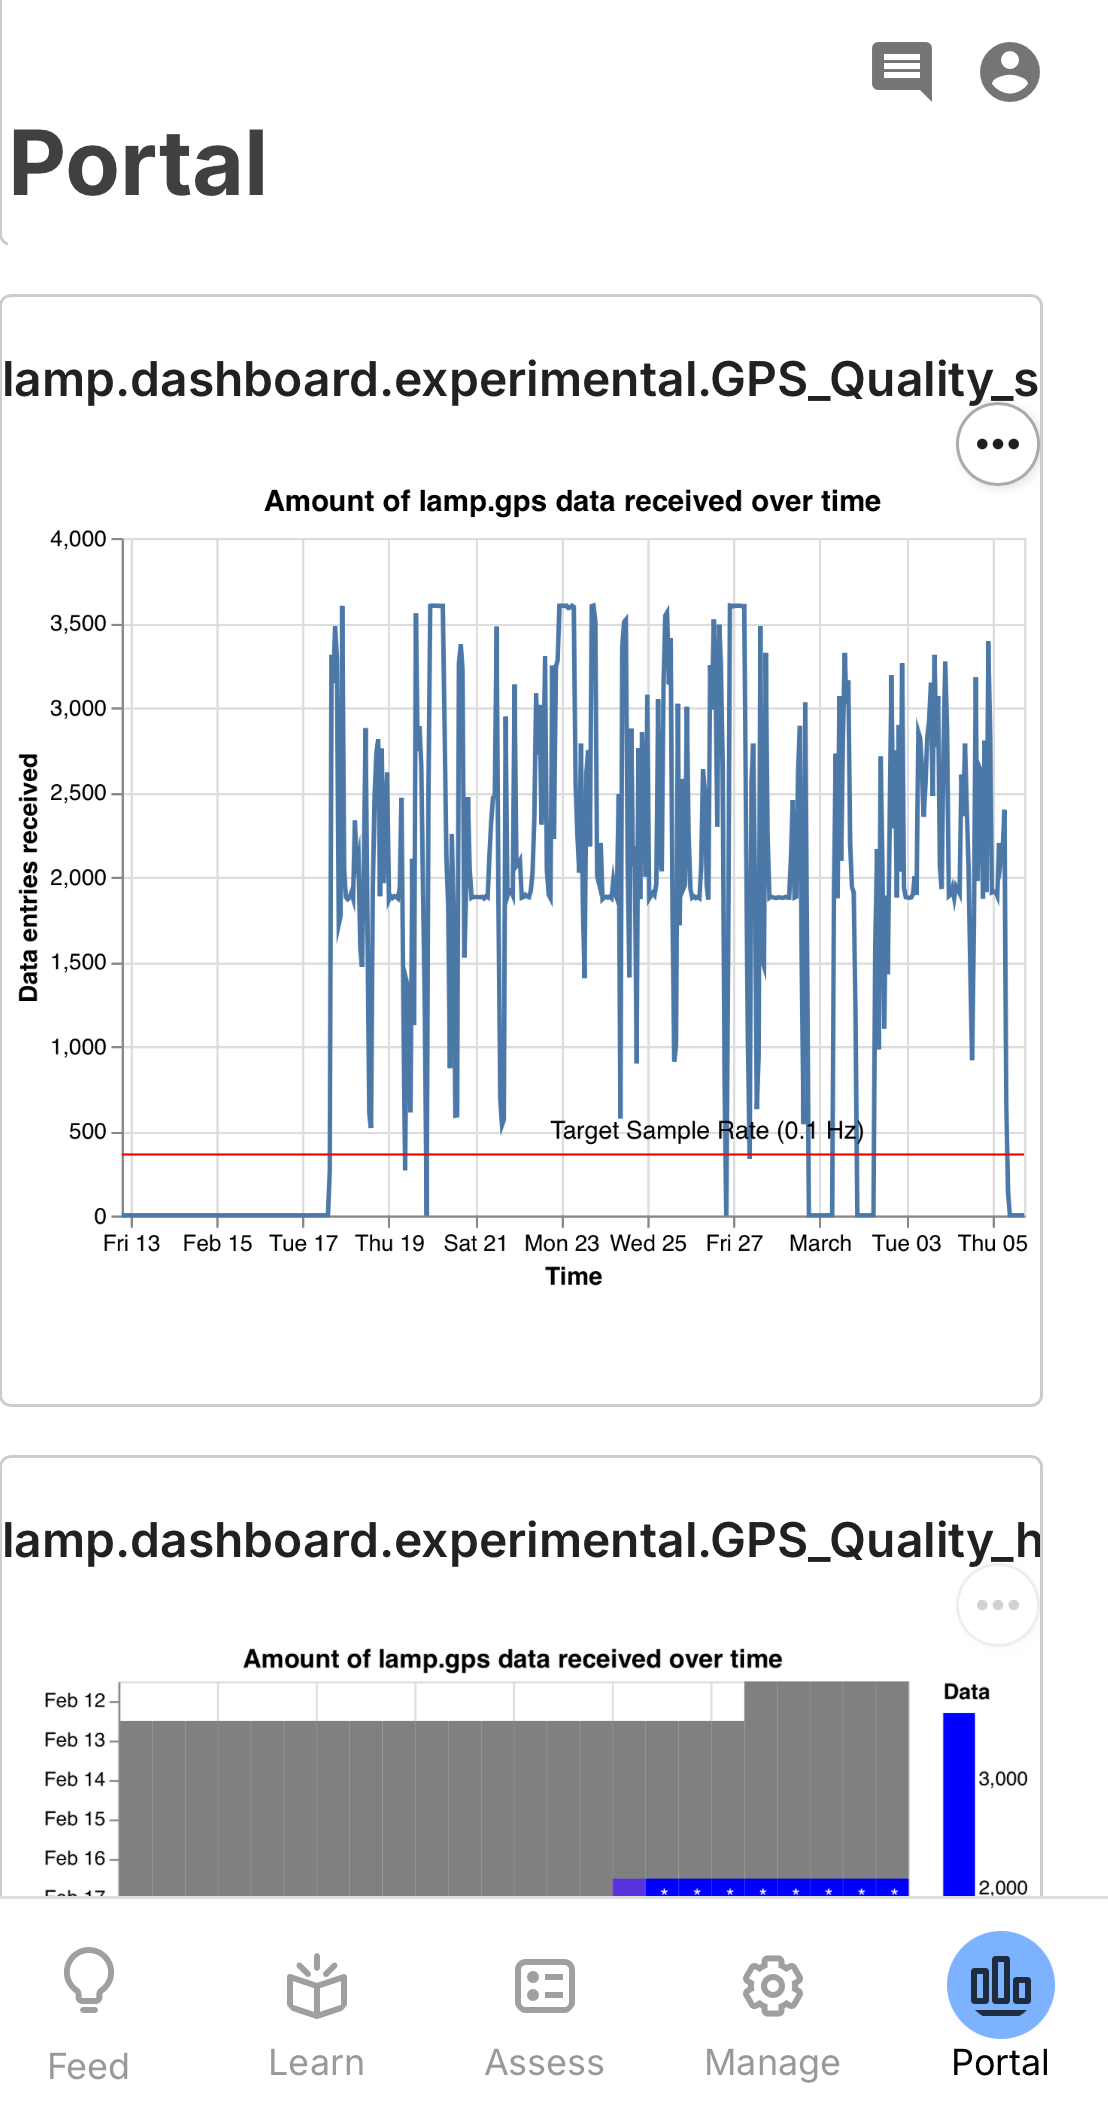
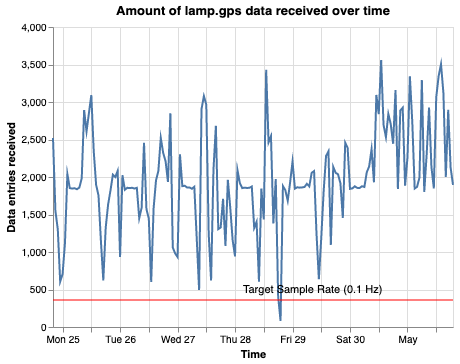
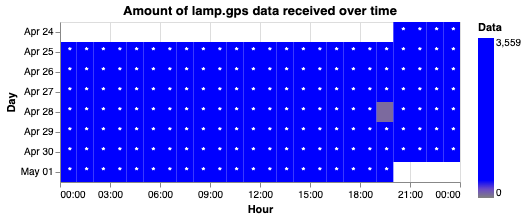
Quantify Data Quality
Cortex automatically evaluates how much sensor data each participant is generating, so you know whether the data is dense enough to compute reliable behavioral features.
In Practice
How monitoring tools work in a real clinical program.
Dive Deeper
Explore the documentation for data quality, dashboards, and visualizations.