Cortex Visualizations
Cortex includes three visualization modules in cortex.visualizations. The participant and data quality modules produce Altair/Vega-Lite chart specifications that can be uploaded directly to the LAMP portal dashboard. The correlation module produces Matplotlib figures for offline analysis.
Participant Visualizations
cortex.visualizations.participant — generates participant-level charts for the LAMP portal.
All functions in this module accept LAMP IDs at any level (participant, study, or researcher). When a study or researcher ID is provided, the function iterates over all participants below it.
passive()
Passive sensor data quality visualization showing when data was received and collection density.
from cortex.visualizations.participant import passive

result = passive(
    id_list="U1234567890",
    sensor_info=[
        {"sensor": "lamp.gps", "target_hz": 0.1, "display_name": "GPS_Quality"},
        {"sensor": "lamp.accelerometer", "target_hz": 3, "display_name": "Accel_Quality"}
    ],
    show_graphs=True,
    attach_graphs='all',
    display_graphs=True,
    days_ago=0,
    sample_length=7,
    set_to_utc_midnight=True,
    return_dict=False,
    reset=False
)
| Parameter | Type | Default | Description |
|---|---|---|---|
id_list | str or list | required | LAMP ID(s) — participant, study, or researcher |
sensor_info | list | GPS + accelerometer | Sensors to visualize, each a dict with sensor (LAMP sensor name), target_hz (expected delivered sampling rate), and display_name (label for graphs and attachments) |
target_hz for GPS defaults to 0.1, not 1The app requests GPS at 1 Hz (once per second), but mobile operating systems aggressively throttle background location delivery. In practice, GPS data points arrive at roughly 0.1 Hz (once per 10 seconds) or less when the app is in the background. Cortex's target_hz reflects this real-world delivered rate — it is used to draw the reference line on scatter plots and to evaluate data quality against realistic expectations, not the configured request rate. Similarly, Cortex's data_quality feature uses 10-minute bins for GPS (not 1-second bins) because this aligns with achievable coverage in background collection.
| show_graphs | bool | True | Display graphs in output |
| attach_graphs | bool or str | 'all' | Attach graphs to participant. Options: True/'all' (both), 'scatter', 'heatmap', or False |
| display_graphs | bool | True | Display graphs on study/researcher portal |
| days_ago | int | 0 | Days ago the analysis window ends (0 = today) |
| sample_length | int | 7 | Window length in days |
| set_to_utc_midnight | bool | True | Align window boundaries to UTC midnight |
| reporter_func | callable | print | Function for logging output (e.g., Slack webhook) |
| return_dict | bool | False | If True, return summary dictionary; else return None |
| reset | bool | False | Delete cached data from previous runs |
Returns: Summary dictionary (if return_dict=True) containing raw data and chart specs per participant and sensor, or None.
Each sensor produces two chart components:
- Scatter plot — data entries received over time, with a target sample rate reference line
- Heatmap — hourly data density by day
| Scatter plot | Heatmap |
|---|---|
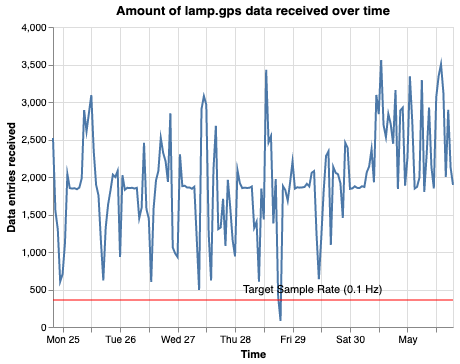 | 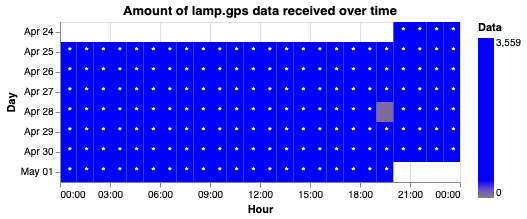 |
Results are cached as LAMP attachments (under lamp.analysis.<display_name>_stored) to speed up subsequent runs. Use reset=True to clear cached data.
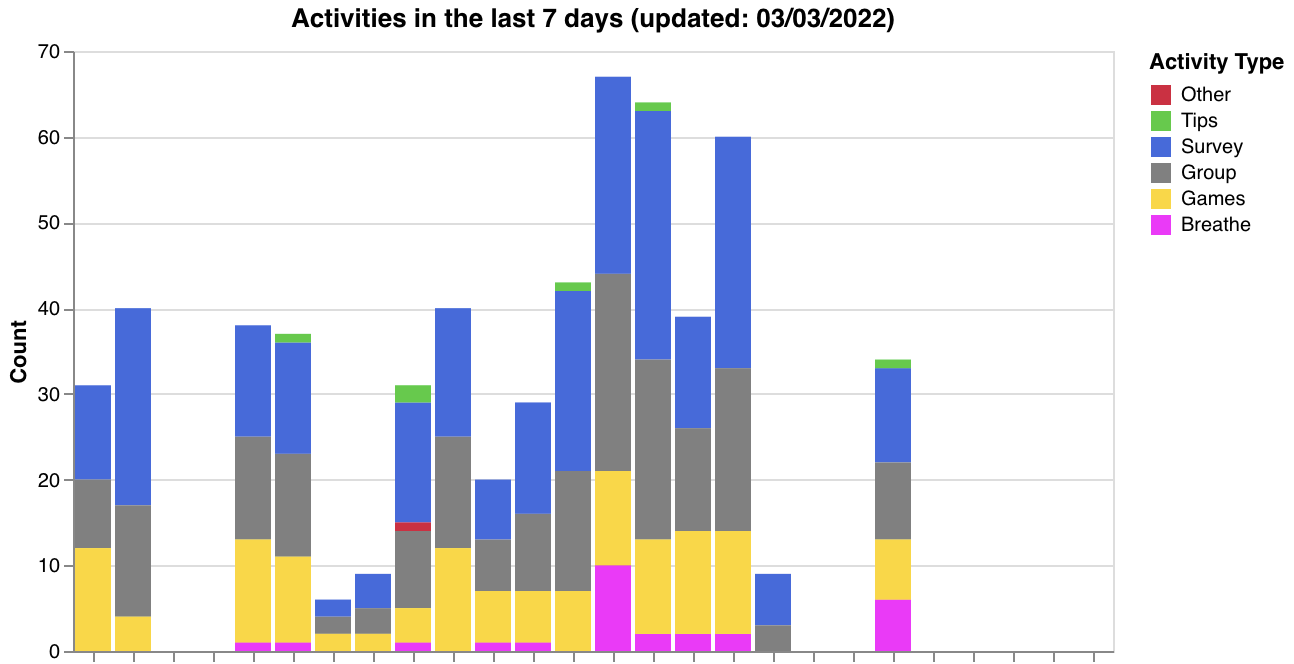
active()
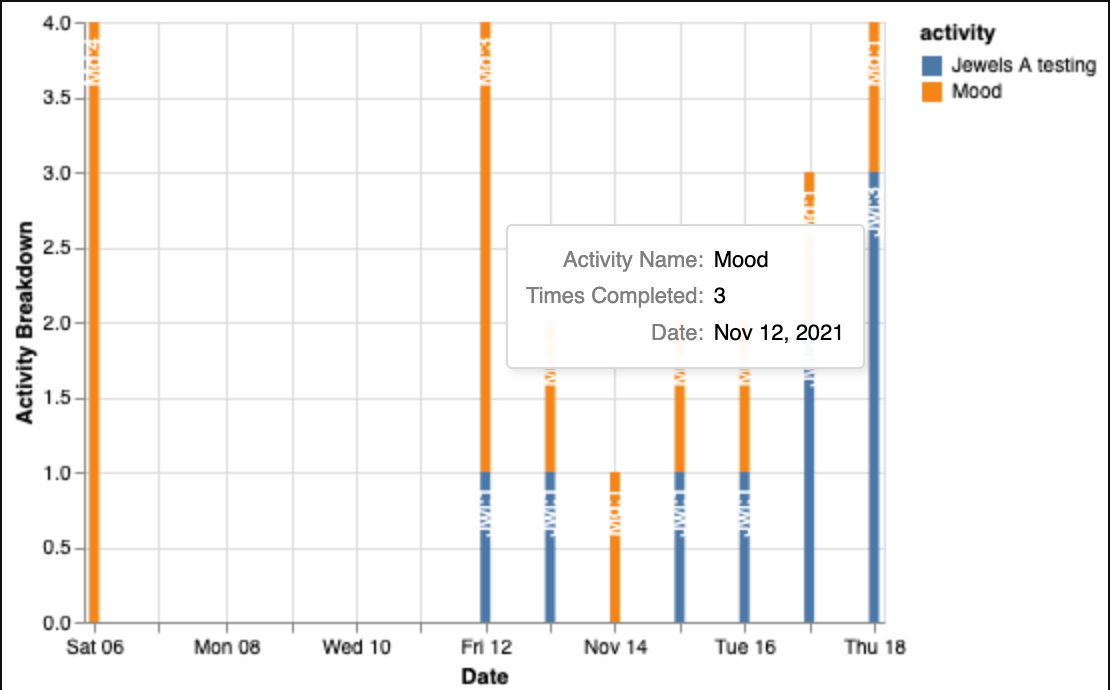
Activity completion visualization showing engagement over time.
from cortex.visualizations.participant import active

result = active(
    id_list="U1234567890",
    target_array=[''],
    exclude_array=None,
    exclude_groups=True,
    show_graphs=True,
    attach_graphs=True,
    display_graphs=True,
    graph_name='lamp.dashboard.experimental.activity_counts',
    days_ago=0,
    sample_length=30,
    reporter_func=print,
    return_dict=False
)
| Parameter | Type | Default | Description |
|---|---|---|---|
id_list | str or list | required | LAMP ID(s) — participant, study, or researcher |
target_array | list | [''] | Filter by activity specs, names, or IDs. Include '' to show all activities |
exclude_array | list | None | Activity names to exclude |
exclude_groups | bool | True | Exclude group activity completions |
show_graphs | bool | True | Display graphs in output |
attach_graphs | bool | True | Attach graphs to participant |
display_graphs | bool | True | Display graphs on study/researcher portal |
graph_name | str | 'lamp.dashboard.experimental.activity_counts' | LAMP attachment key for the graph |
days_ago | int | 0 | Days ago the analysis window ends (0 = today) |
sample_length | int | 30 | Window length in days |
reporter_func | callable | print | Function for logging output |
return_dict | bool | False | If True, return data dictionary; else return None |
Returns: Dictionary of DataFrames per participant (if return_dict=True), or None. Generates a stacked bar chart of activity counts by type over time with interactive tooltips.
cortex_tertiles()
Tertile analysis of Cortex features, categorizing values into high/medium/low bands with color-coded temporal trends.
from cortex.visualizations.participant import cortex_tertiles

result = cortex_tertiles(
    target_id="U1234567890",
    cortex_measures=['acc_energy', 'entropy', 'hometime', 'screen_duration'],
    measure_params={},
    use_cache=False,
    show_graphs=True,
    attach_graphs=True,
    display_graphs=True,
    days_ago=0,
    sample_length=7,
    set_to_utc_midnight=True,
    reporter_func=print,
    return_dict=False
)
| Parameter | Type | Default | Description |
|---|---|---|---|
target_id | str or list | required | LAMP ID(s) — participant, study, or researcher |
cortex_measures | str, list, or dict | ['acc_energy', 'entropy', 'hometime', 'screen_duration'] | Cortex features to analyze. If a dict, keys are feature names and values are display labels (e.g., {'sleep_periods': 'Sleep'}) |
measure_params | dict | {} | Parameters to pass to cortex.run() |
use_cache | bool | False | Use cached Cortex data |
show_graphs | bool | True | Display graphs in output |
attach_graphs | bool | True | Attach graphs to participant |
display_graphs | bool | True | Display graphs on study/researcher portal |
days_ago | int | 0 | Days ago the analysis window ends (0 = today) |
sample_length | int | 7 | Window length in days |
set_to_utc_midnight | bool | True | Align window boundaries to UTC midnight |
reporter_func | callable | print | Function for logging output |
return_dict | bool | False | If True, return results dictionary; else return None |
Returns: Dictionary containing raw Cortex output and Vega-Lite chart specs per participant (if return_dict=True), or None.
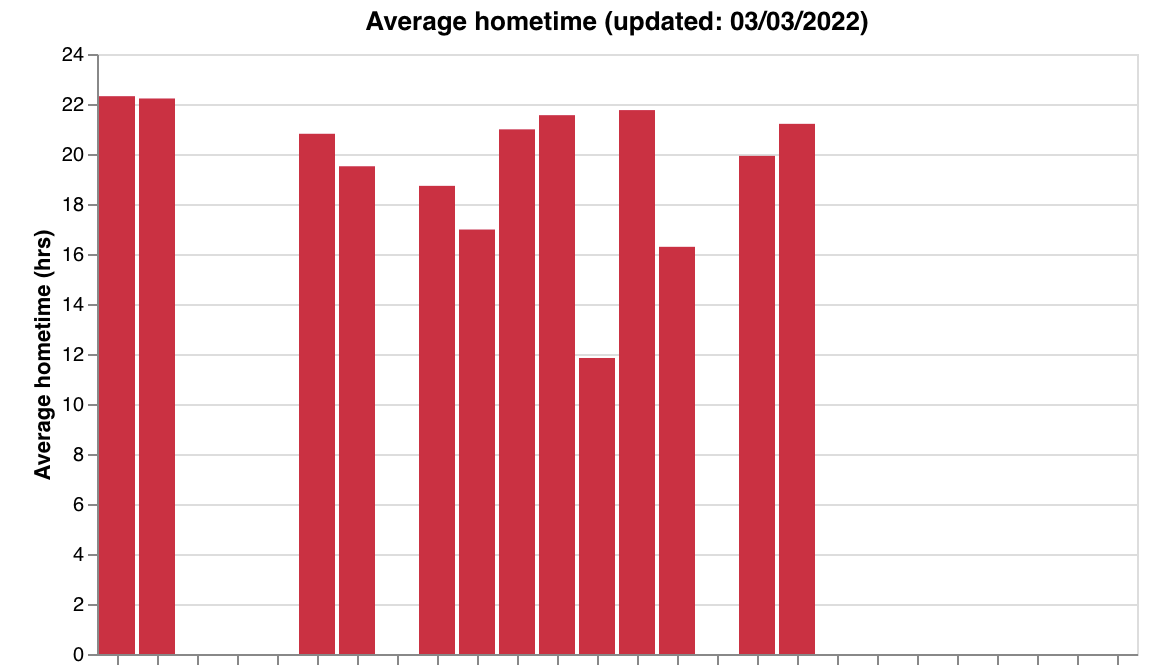
Tertile boundaries are computed from the data range: values above the upper third are "High" (blue), between upper and lower third are "Medium" (salmon), below the lower third are "Low" (goldenrod), and exactly zero are "Zero" (black).
| Screen duration | Hometime | Entropy |
|---|---|---|
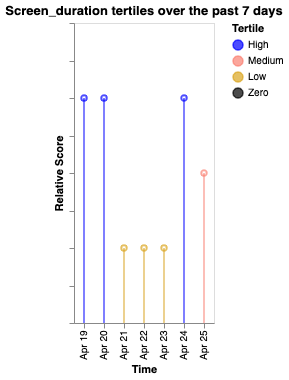 | 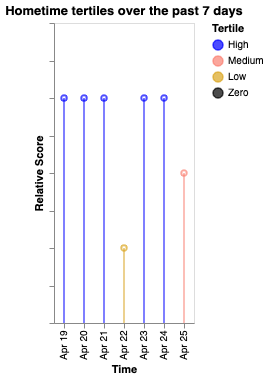 | 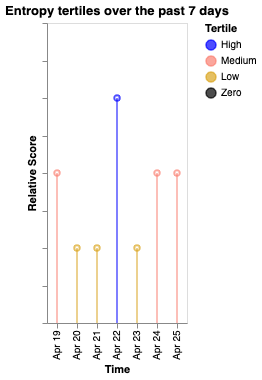 |
create_sample_window()
Helper to define a time window for analysis.
from cortex.visualizations.participant import create_sample_window

start, end = create_sample_window(
    end_of_window=7,
    sample_length=7,
    set_to_utc_midnight=True
)
# Returns (start_ms, end_ms) for the window 14–7 days ago
| Parameter | Type | Default | Description |
|---|---|---|---|
end_of_window | int | required | Number of days ago the window ends |
sample_length | int | required | Window length in days (goes backward from end_of_window) |
set_to_utc_midnight | bool | required | Align boundaries to UTC midnight |
Returns: Tuple of (start_timestamp_ms, end_timestamp_ms).
Data Quality Dashboard
cortex.visualizations.data_quality — researcher-level data quality monitoring. These functions generate visualizations and upload them directly to the LAMP portal.
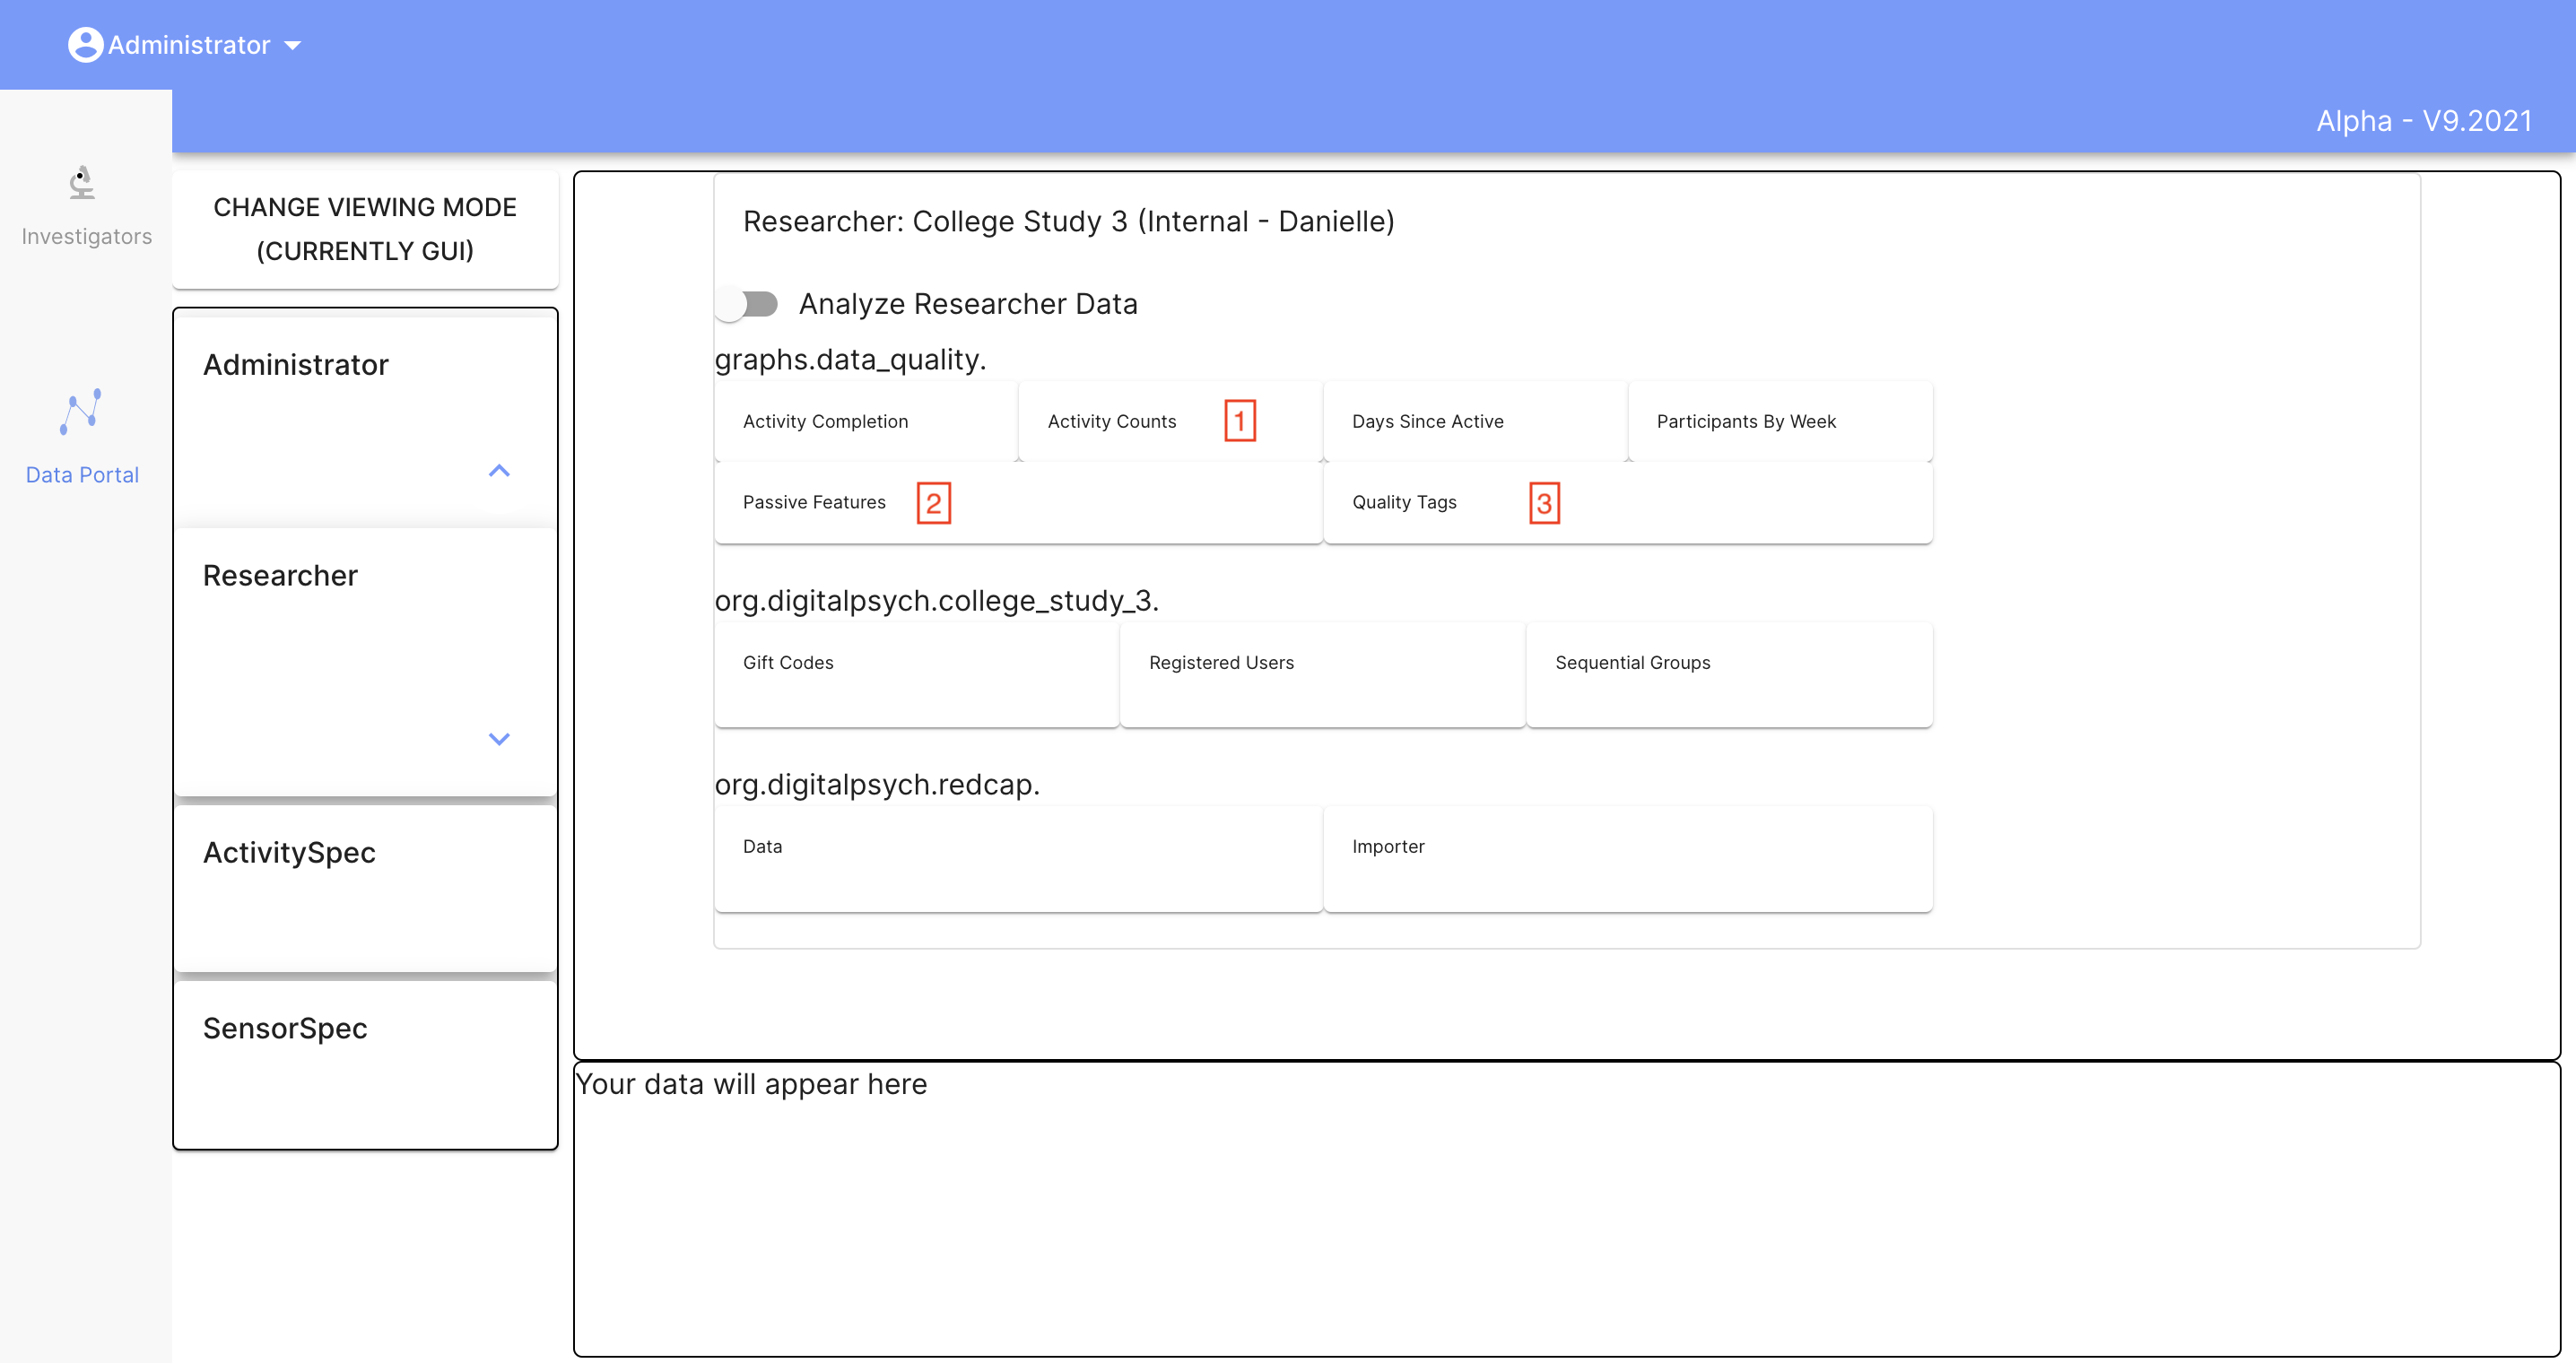
data_quality()
Generates a comprehensive quality report for all participants under a researcher. Orchestrates all helper functions below.
import cortex.visualizations.data_quality as dq

dq.data_quality(researcher_id="R1234567890")
| Parameter | Type | Default | Description |
|---|---|---|---|
researcher_id | str | required | Researcher LAMP ID |
Returns: None — uploads graphs directly to the LAMP portal. The analysis window is the most recent 7 days (hardcoded).
Generated visualizations:
- Activity type breakdown across participants (
make_activity_count_graph) - Data quality status tags (
make_data_qual_tags) - Passive feature summaries — steps, screen duration, hometime (
make_passive_data_graphs)
| Quality tags | Legend |
|---|---|
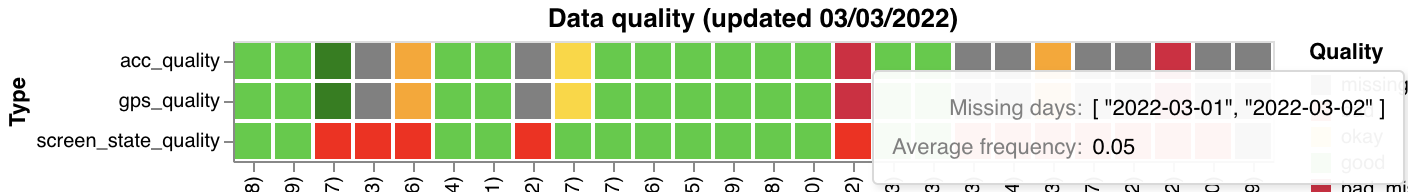 | 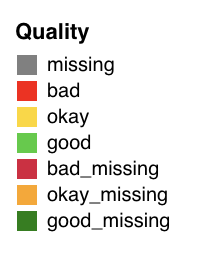 |
| Steps | Screen duration | Hometime |
|---|---|---|
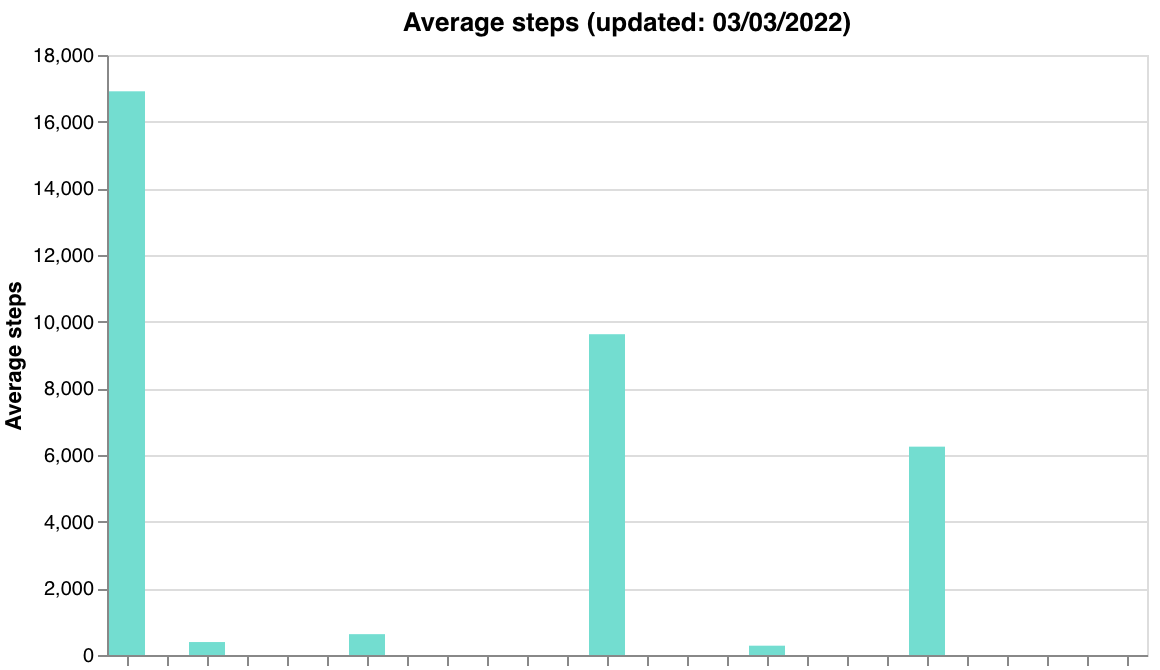 |  |  |
Quality thresholds:
| Sensor | Good | Okay | Bad |
|---|---|---|---|
| GPS | >0.8 | 0.5–0.8 | <0.5 |
| Accelerometer | >0.8 | 0.5–0.8 | <0.5 |
| Screen State | Data every day in window | — | Missing days |
Quality tags append _missing (e.g., good_missing) when a sensor has overall good quality but is missing data on specific days. A sensor with no data at all is tagged missing.
Helper functions
These are called internally by data_quality() but can also be used individually. Note that most require pre-computed data from other helpers — they do not accept simple (researcher_id, days) signatures.
| Function | Signature | Description |
|---|---|---|
get_parts(researcher_id) | (researcher_id) | Returns list of dicts with participant_id and study_name for all participants under a researcher |
get_data_tags_df(participants) | (participants) | Assess data quality per participant. Takes output from get_parts(). Returns (qual_df1, qual_df2) — raw quality DataFrame and plotting-ready DataFrame |
make_activity_count_graph(participants, researcher_id) | (participants, researcher_id) | Activity type breakdown chart (Survey, Tips, Breathe, Group, Games, Other) |
make_data_qual_tags(researcher_id, qual_df2) | (researcher_id, qual_df2) | Quality status heatmap. Takes qual_df2 from get_data_tags_df() |
make_passive_data_graphs(participants, researcher_id, qual_df1) | (participants, researcher_id, qual_df1) | Feature summary charts for steps, screen duration, and hometime. Takes qual_df1 from get_data_tags_df(). Features are hardcoded |
make_survey_count_graph_by_name(participants, researcher_id, name) | (participants, researcher_id, name) | Survey completion counts for a specific survey (exact name match) |
make_percent_completion_graph(spec, researcher_id, name) | (spec, researcher_id, name) | Activity compliance rates. spec is a dict mapping IDs to expected activity counts (see below) |
clear_chart(researcher_id, name) | (researcher_id, name) | Remove a specific chart from the LAMP portal by name |
Typical workflow using helpers individually:
import cortex.visualizations.data_quality as dq

# Step 1: Get participants
participants = dq.get_parts("R1234567890")

# Step 2: Compute quality tags
qual_df1, qual_df2 = dq.get_data_tags_df(participants)

# Step 3: Generate individual charts
dq.make_activity_count_graph(participants, "R1234567890")
dq.make_data_qual_tags("R1234567890", qual_df2)
dq.make_passive_data_graphs(participants, "R1234567890", qual_df1)
dq.make_survey_count_graph_by_name(participants, "R1234567890", "Daily Survey")
make_percent_completion_graph spec format:
spec = {
    "U1234567890": [
        {"activity_name": "Daily Survey", "count": 7, "time_interval": 7 * 86400000},
        {"activity_name": "Weekly Check-in", "count": 1, "time_interval": 7 * 86400000}
    ]
}
dq.make_percent_completion_graph(spec, "R1234567890", "compliance")
Each entry specifies an activity name, the expected completion count, and the time interval (in ms) to check. Participants can be grouped under any LAMP ID level.
# Clear a specific chart
dq.clear_chart("R1234567890", "compliance")
Correlation Analysis
cortex.visualizations.correlation_functions — statistical analysis and correlation plotting for research. Unlike the other modules, these produce local Matplotlib figures rather than LAMP portal uploads.
get_corr()
Compute Pearson correlations with Benjamini-Hochberg FDR correction for multiple testing.
from cortex.visualizations.correlation_functions import get_corr

mat, pvals, corr_df = get_corr(
    combined_df0,
    survey_list=["PHQ-9", "GAD-7"],
    feat_list=["screen_duration", "step_count", "hometime"],
    req_list=[],
    alpha=0.05,
    show_num=1
)
| Parameter | Type | Default | Description |
|---|---|---|---|
combined_df0 | DataFrame | required | Combined feature data with columns for all surveys and features |
survey_list | list | required | Survey/outcome variable names (row labels in the matrix) |
feat_list | list | required | Feature/predictor variable names (column labels in the matrix) |
req_list | list | [] | Filter criteria — list of dicts with col_name, val, greater_than (1 for >, 0 for <) |
alpha | float | 0.05 | Significance level for FDR correction |
show_num | int | 1 | Include correlation coefficient values in output strings |
Returns:
mat— correlation matrix (numpy array, shape: surveys x features)pvals— list of string arrays with coefficients and*for significant correlations after FDR correctioncorr_df— DataFrame with columnskey,corr,p-val, andN
make_corr_plot()
Create a correlation heatmap from get_corr() output.
from cortex.visualizations.correlation_functions import make_corr_plot

fig = make_corr_plot(mat, pvals, survey_list, feat_list, title="Feature Correlations")
| Parameter | Type | Default | Description |
|---|---|---|---|
mat | numpy array | required | Correlation matrix from get_corr() |
pvals | list | required | Significance strings from get_corr() |
survey_list | list | required | Row labels |
feat_list | list | required | Column labels |
title | str | "" | Plot title |
Returns: Matplotlib figure — seaborn heatmap (color scale -0.5 to 0.5) with significance asterisks after FDR correction. Axis labels are shown when there are fewer than 10 items.
| Correlation heatmap | Feature key |
|---|---|
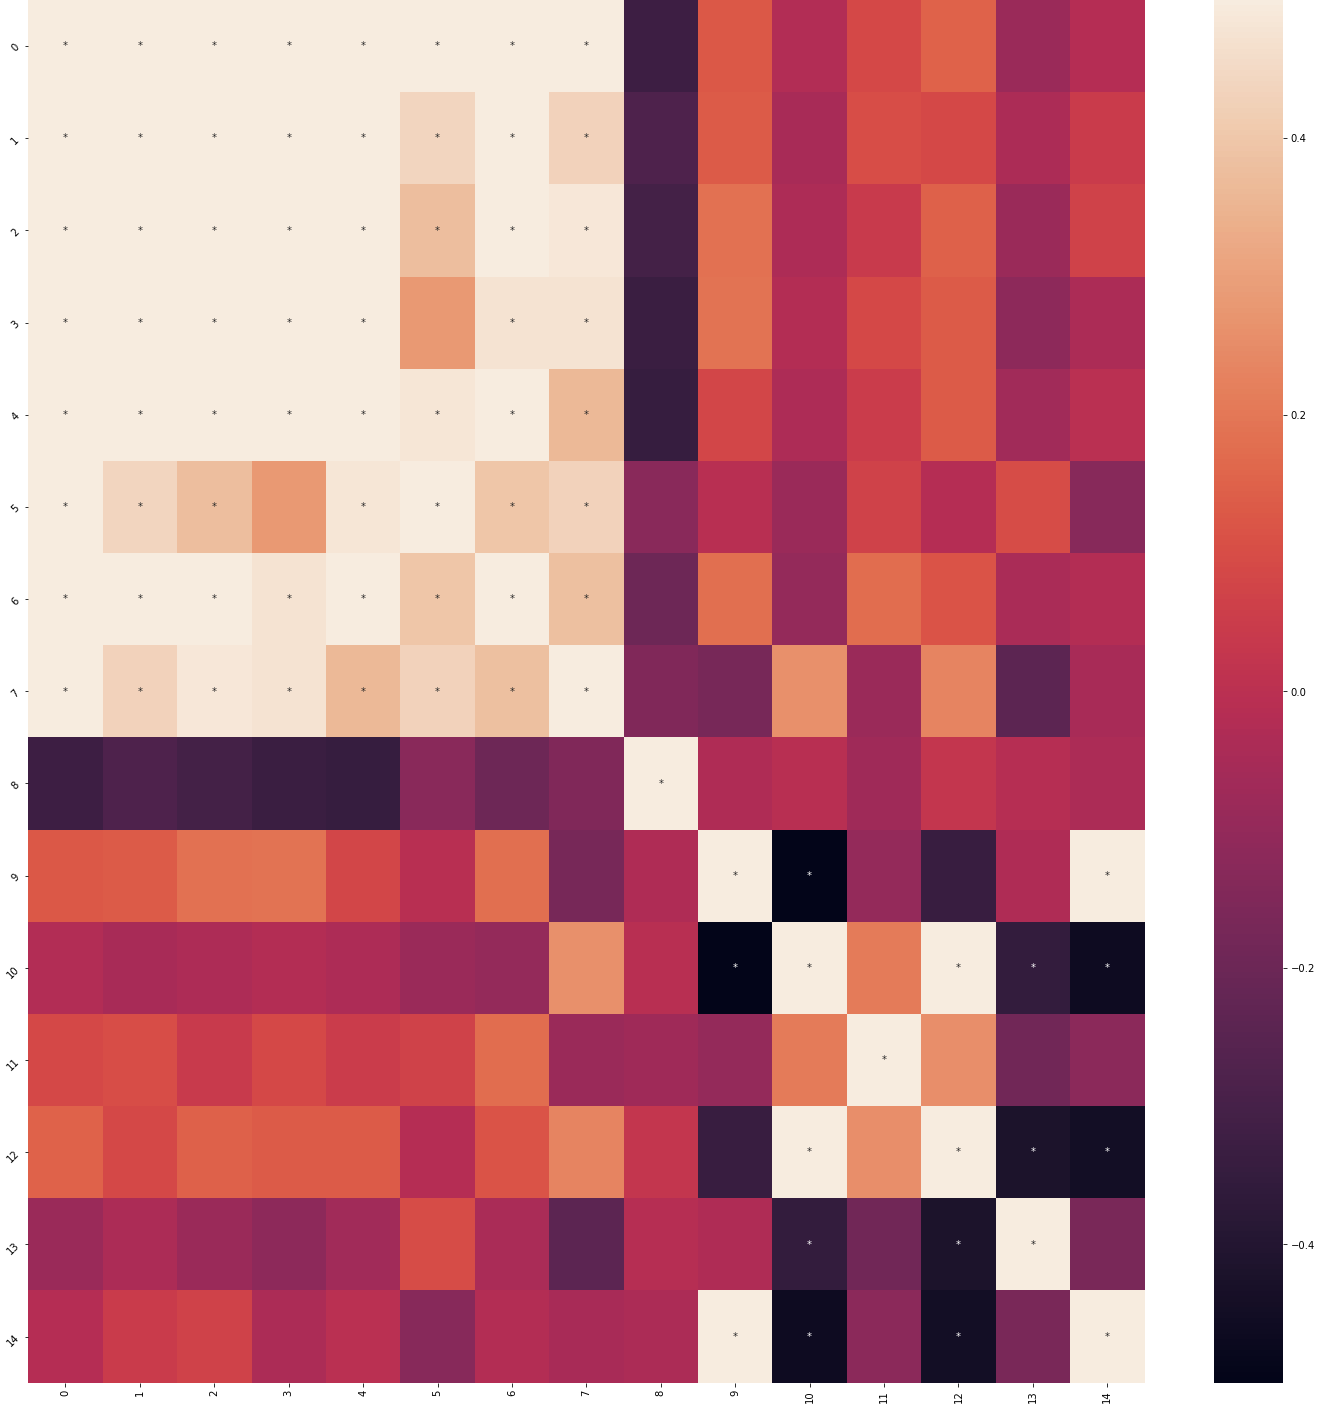 |  |
get_avg_var_data()
Compute average or variance for features across participants. Reads pre-saved survey CSVs and passive data pickle files from disk.
from cortex.visualizations.correlation_functions import get_avg_var_data

avg_df = get_avg_var_data(
    parts=participant_ids,
    scoring_guide=scoring_dict,
    other_global_feats=["step_count"],
    other_local_feats=["screen_duration"],
    other_local_subfeats={"screen_duration": ["col1", "col2"]},
    passive_feats=["hometime"],
    survey_dir="/path/to/surveys/",
    passive_dir="/path/to/passive/",
    avg=1,
    time_to_include=[-1, -1]
)
| Parameter | Type | Default | Description |
|---|---|---|---|
parts | list | required | Participant IDs |
scoring_guide | dict | required | Survey scoring dictionary with category_list and questions keys |
other_global_feats | list | required | Global features (read from <id>_other_global_feats.csv) |
other_local_feats | list | required | Local features (read from <id>_<feat>.csv) |
other_local_subfeats | dict | required | Sub-columns to extract per local feature |
passive_feats | list | required | Passive features (read from <id>_<feat>.pkl) |
survey_dir | str | required | Directory containing survey and feature CSVs |
passive_dir | str | required | Directory containing passive data pickle files |
avg | int | 1 | 1 for average, 0 for variance |
time_to_include | list | [-1, -1] | [start_offset_ms, end_offset_ms] relative to first SensorEvent. [-1, -1] includes all time |
Returns: DataFrame with part_id and one column per feature containing averages or variances.
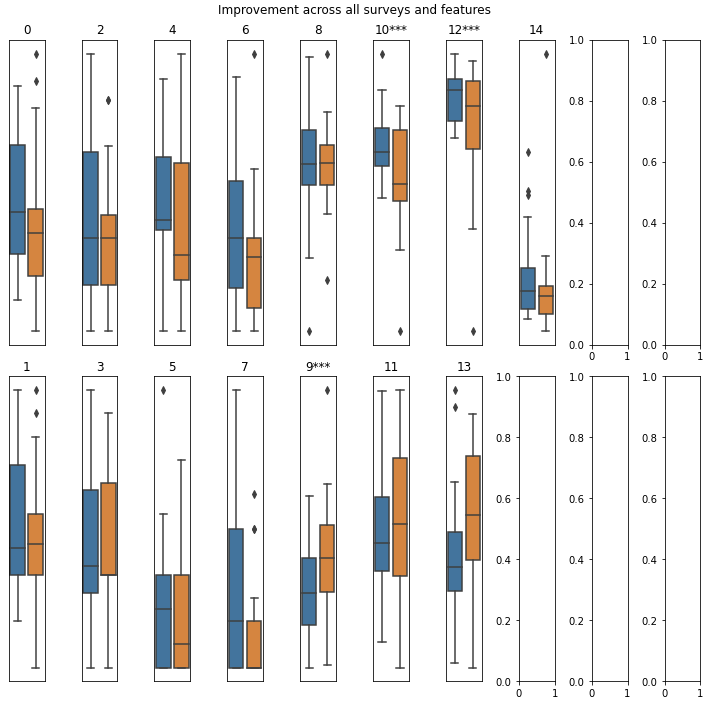
produce_improvement_df0()
Track feature changes over time relative to baseline — for treatment response and longitudinal outcome analysis.
from cortex.visualizations.correlation_functions import produce_improvement_df0

improvement_df = produce_improvement_df0(
    parts=participant_ids,
    feature_name="PHQ-9",
    amount_change=5.0,
    feat_dir_0="/path/to/features/",
    fn_0="phq9.csv",
    min_num_records=2,
    min_starting_score=0,
    min_time_diff=0
)
| Parameter | Type | Default | Description |
|---|---|---|---|
parts | list | required | Participant IDs |
feature_name | str | required | Column name in the feature file to compare |
amount_change | float | required | Minimum change threshold (start - end). If between 0 and 1, treated as a proportion |
feat_dir_0 | str | required | Directory containing feature files |
fn_0 | str | required | Feature filename (e.g., phq9.csv). Full path: <feat_dir_0><participant_id>_<fn_0> |
min_num_records | int | 2 | Minimum records required (must be at least 2) |
min_starting_score | float | 0 | Only include participants with at least this starting score |
min_time_diff | float | 0 | Minimum time difference (ms) between first and last records |
Returns: DataFrame with columns part_id, improved (bool or None if criteria not met), and change (last value - first value).
save_surveys_to_file()
Export survey scores to CSV files, one per scoring category.
from cortex.visualizations.correlation_functions import save_surveys_to_file

save_surveys_to_file(
    part_id="U1234567890",
    survey_path="/path/to/output/",
    scoring_dict=scoring_dict
)
# Creates files like U1234567890_anxiety.csv, U1234567890_depression.csv
| Parameter | Type | Default | Description |
|---|---|---|---|
part_id | str | required | Participant ID |
survey_path | str | required | Output directory path |
scoring_dict | dict | required | Survey scoring dictionary with category_list and questions keys |
Returns: None — writes CSV files to disk. Each file is named <part_id>_<category>.csv with columns for each question in that category plus a timestamp column. Calls cortex.primary.survey_scores internally with return_ind_ques=True.