Participant-Level Visualizations
At times, it may be necessary to run specific analyses on one participant - for example, to ensure continuous data quality monitoring or check the level of interaction with LAMP. The following functions are designed to run on a specific participant and return information that may be helpful either with monitoring LAMP data collection or examining cortex scores
Passive Data Quality
Function
cortex.visualizations.participant.passive(id)
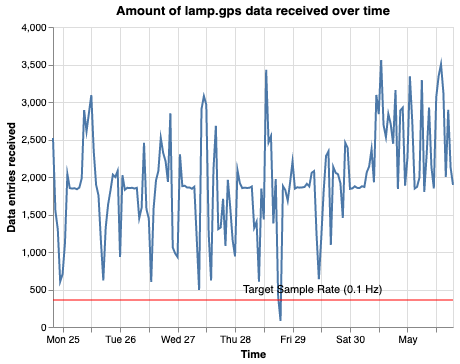
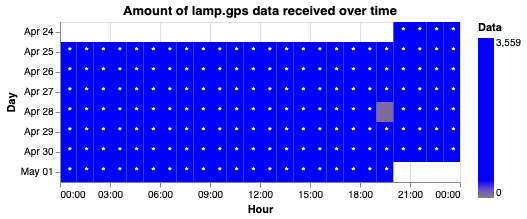
This function produces two graphs intended to help assess data quality - a scatterplot and a heatmap, which both show on an hourly level the amount of data collected over the previous week. Data is stored in attachments to prevent unnecessary server load on subsequent runs - as such, this can be run repeatedly throughout the week to speed up individual runs.
Parameters
id_list: A string or array of strings of LAMP ids (participant, study, researcher)show_graphs: If True, graphs are displayed in the outputattach_graphs: If True, graphs are attached to the participantdisplay_graphs: If True, graphs are attached to the study and researcher for displaydays_ago: The number of days ago the analysis should end. If 0, analysis ends on the current timestampsample_length: The number of days to query data forset_to_utc_midnight: If True, timestamps are adjusted to UTC midnightreporter_func: The function that should output important logging info. Use with a webhook, for example logging to slackreturn_dict: If true, returns a dictionary containing data output. Else returns None.reset: If true, data from previous runs will be deleted.
Code Example
researcher_id='ffmz65mn1gtav5fq3bhq'
cortex.visualizations.participant.passive(researcher_id,attach_graphs=False)
First Time:
Found no U5946075691 data under lamp.analysis.Accel_Quality_stored
Querying for U5946075691 - Accel_Quality
Repeat Time:
Querying for U5946075691 - GPS_Quality
Previous data was found. 168 chunks were excluded.
Scatterplot:
Heatmap:
Active Data Quality
Function
cortex.visualizations.participant.active(id)
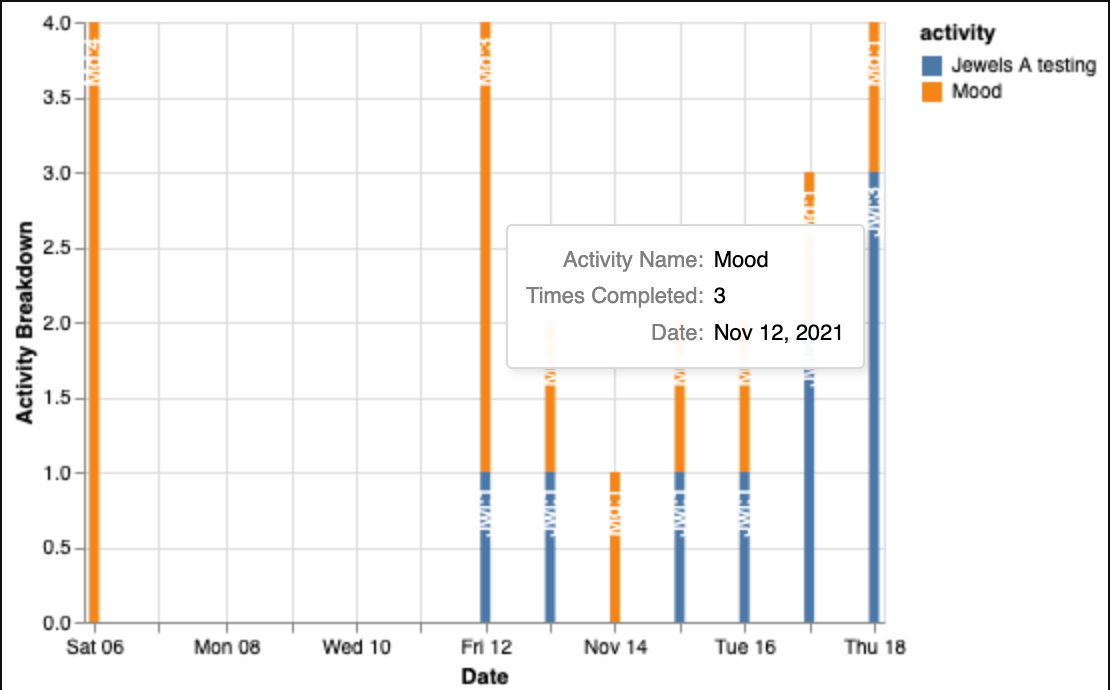
This function produces a graph intended to help assess participant interaction with lamp - a stacked bar chart, which shows on an daily level the number of LAMP activities collected each day.
Parameters
id_list: a string or array of strings of LAMP ids(participant, study, researcher)target_array: a list of specs, names, or ids to display. Default is all. Include '' to show all activities.exclude_array: a list of names to exclude. Default is None.exclude_groups: attempt to exclude group completionsshow_graphs: if True, graphs are displayed in the outputattach_graphs: if True, graphs are attached to the participantdisplay_graphs: if True, graphs are attached to the study and researcher for displaygraph_name: set to another string to override the default namedays_ago: the number of days ago the analysis should end.If 0, analysis ends on the current timestampsample_length: The number of days to query data forreporter_func: The function that should output important logging info.Use with a webhook, for example logging to slackreturn_dict: If true, returns a dictionary containing data output. Else returns None.
Code Example
cortex.visualizations.participant.active('U1978824471',attach_graphs=True,days_ago=160,sample_length=30)
Cortex Tertiles
Function
cortex.visualizations.participant.cortex_tertiles(id)
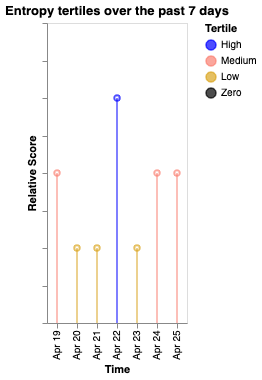
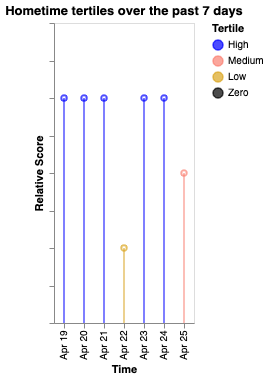
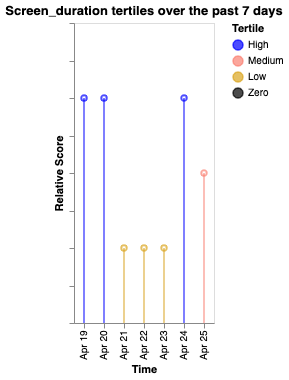
This function produces a graph intended to help assess how participant's cortex measures change day by day. Using a 'lollipop' chart, researcher can visualize whether a particpant's scores on different cortex measures are high, medium, or low, relative to a week's worth of measurements.
Parameters
target_id: Required. a string or array of LAMP user, study, or researcher ids.All user ids below one or more ids in the list (if applicable) will be runcortex_measures: Default:['acc_energy','entropy','hometime','screen_duration']. a string, list, or dict of cortex measures. If a dict, keys will be used for the array fed into run and the values will be used as labels. E.g.{'sleep_periods':'Sleep'}measure_params: Measure params to pass into cortexuse_cache: If true, attempt to use cached datashow_graphs:Default True. a boolean - whether to show graphs generated to the user running the function callattach_graphs:Default True. a boolean - whether to attach graphs to the participant as a tagdisplay_graphs:Default True. a boolean - whether to display graphs tothe participant on their prevent pagedays_ago: Default 0. Number of days ago to end analysis. Set to 0 to end analysis todaysample_length: Default 7. Timespan for analysis, in days.reporter_func: Default 'print'. A function which should take one variable,which are outputs from this function, and displays them to a userset_to_utc_midnight: Default True. Whether or not to set the utc time to truereturn_dict: Default False. Whether or not to return a dictionary of all cortex outputs at the end.
Code Example
cortex.visualizations.participant.cortex_tertiles(['U1978824471'],attach_graphs=True,use_cache=True)